
From Microeconomics to Hummingbird Economics During COVID-19
An old African tale tells the story of when a fire erupted in the forest. All animals started running and amongst them there was the king of the forest, the lion. Whilst he was fleeing, he lifted his head and saw a hummingbird flying in the opposite direction.
“Where are you going?”, asked the lion. “I am flying to the lake to collect water with my beak and throw it over the fire”, replied the hummingbird. “Don’t be foolish” said the lion, “do you really believe that you’ll be able to extinguish this huge fire with four drops of water?” The hummingbird proudly replied, “It does not matter, I am just doing my part”.
But what is the link between microeconomics, hummingbirds and COVID-19? Below lies the answer.
The aim of this article is to show the changes of the demand and supply curves of face masks and how their prices have evolved from a pre-COVID-19 world to today.
There are roughly three families of face masks: surgical grade respirators, surgical masks and non-surgical masks. Respirators are tight-fitting, designed to create a facial seal and meant to protect the wearer; whereas masks are loose fitting and designed to protect others from the spread of the wearer's body fluids.
Pre-COVID-19
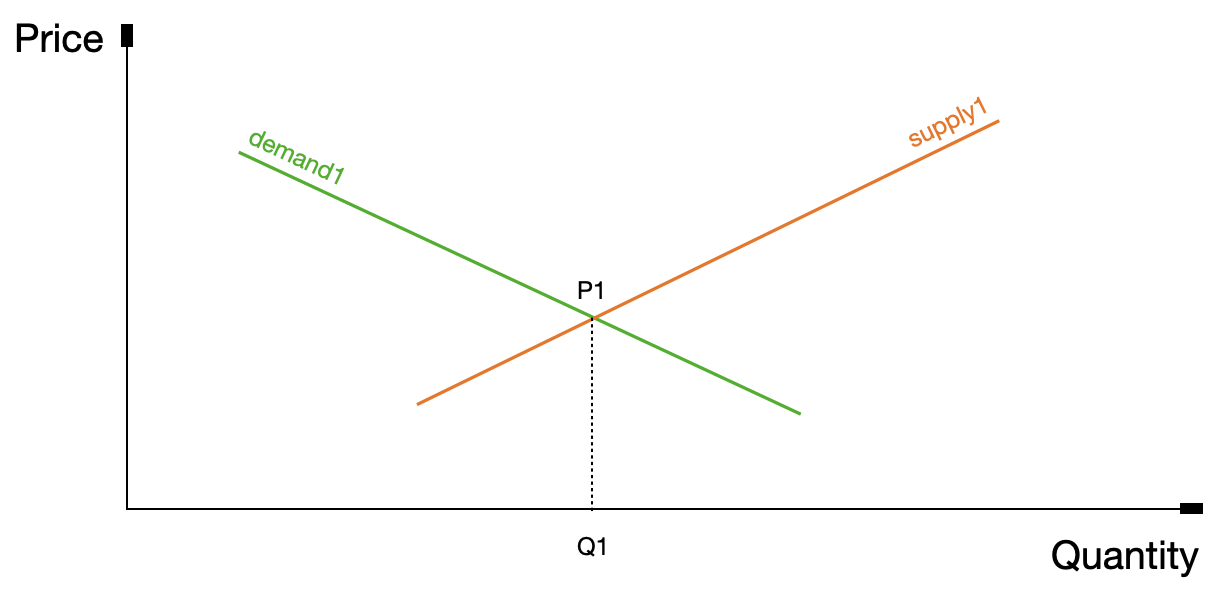
The green curve represents the ‘normal’ demand curve for face masks in pre-COVID-19 times. The supply curve is the orange curve. In a pre-COVID-19 world there were three distinct markets for the three types of masks, each having a clearly defined buyer and supplier segment.
For simplicity’s sake we will just keep one demand and one supply curve, where we are at an initial equilibrium price P1 for the quantity supplied Q1.
Immediately after the COVID-19 outbreak
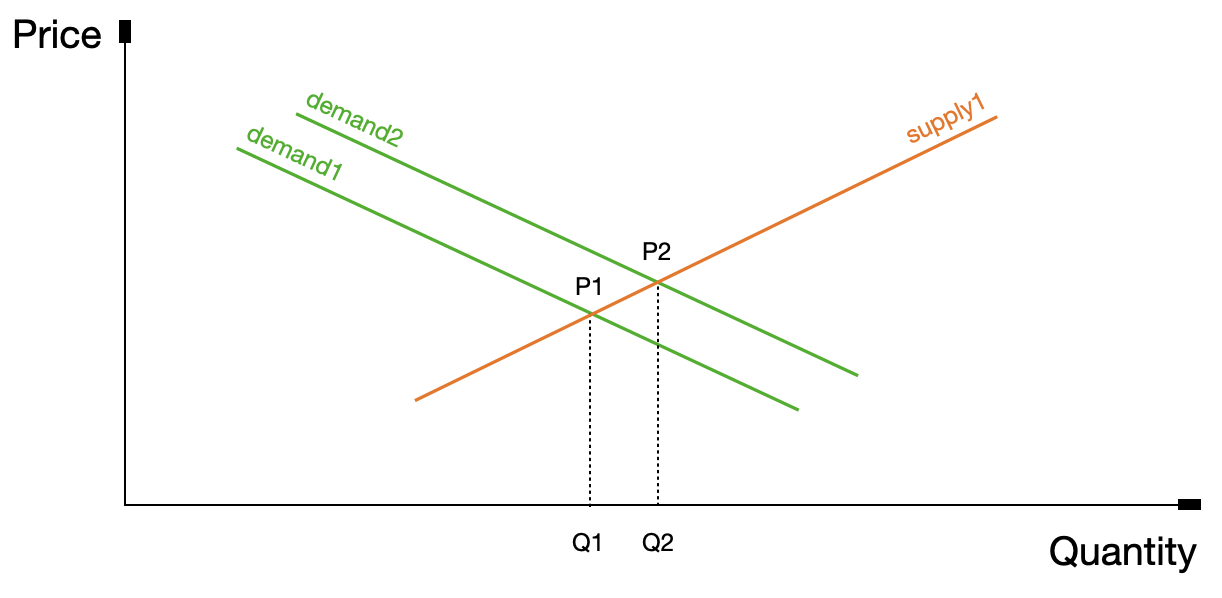
Right at the beginning of the COVID-19 outbreak, hospitals and healthcare providers relied mostly on the face masks they had in stock for the initial increase in cases. As cases started to rise even further, and it became evident that this was a serious health situation, the demand for face masks increased, going from demand1 to demand2.
As the supply of face masks did not change, a new short-run equilibrium was found at a price P2, with the quantity being supplied also increasing from Q1 to Q2. In reality, the possibility of a mid-run supply shortage started to become evident and public healthcare providers’ concerns surged.
Some time after the COVID-19 outbreak
March was the key month for the outbreak in Italy. The general public started to realise how serious this virus was and the demand for face masks increased significantly. The below graph shows the Google search trend of the word “mascherine” (Italian for face mask) since the beginning of the year in Italy. The peak occurred on March 10th. The Google searches for the word ”mascherine” are still very high as of today, with no clear sign of declining.

Pharmacies quickly depleted all stocks and supply was mainly channelled towards public healthcare providers.
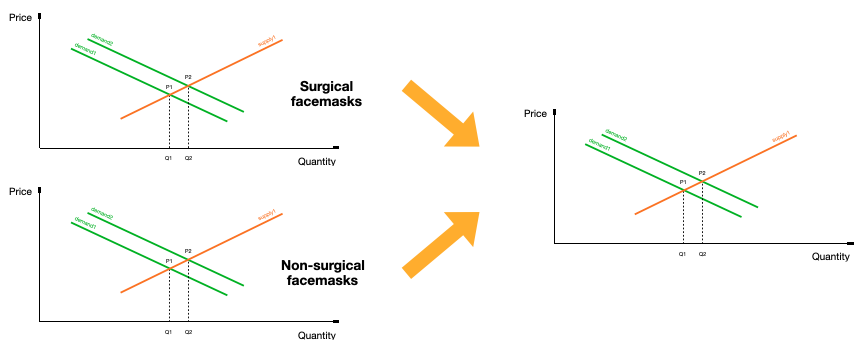
At the same time, the demand for non-surgical masks also increased substantially. The media reported confusing information about the effectiveness of non-surgical face masks and the Italian Health Ministry failed to give clear guidelines.
This led to a convergence of demand curves where the demand for surgical face masks and non-surgical face masks increased whereby any face mask (surgical or non-surgical) was perceived as being good enough to keep safe.
As expected, by the end of March, the lack of supply eventually created a black market of fake and below medical grade face masks at astronomical prices.
During the COVID-19 lockdown
On March 11th, 2020 the Italian government imposed strict restrictions. All retail businesses, educational activities, catering services are suspended, and gatherings of people in public places or open to the public are prohibited. The only authorised activity was the purchase of groceries with the use of a face mask.
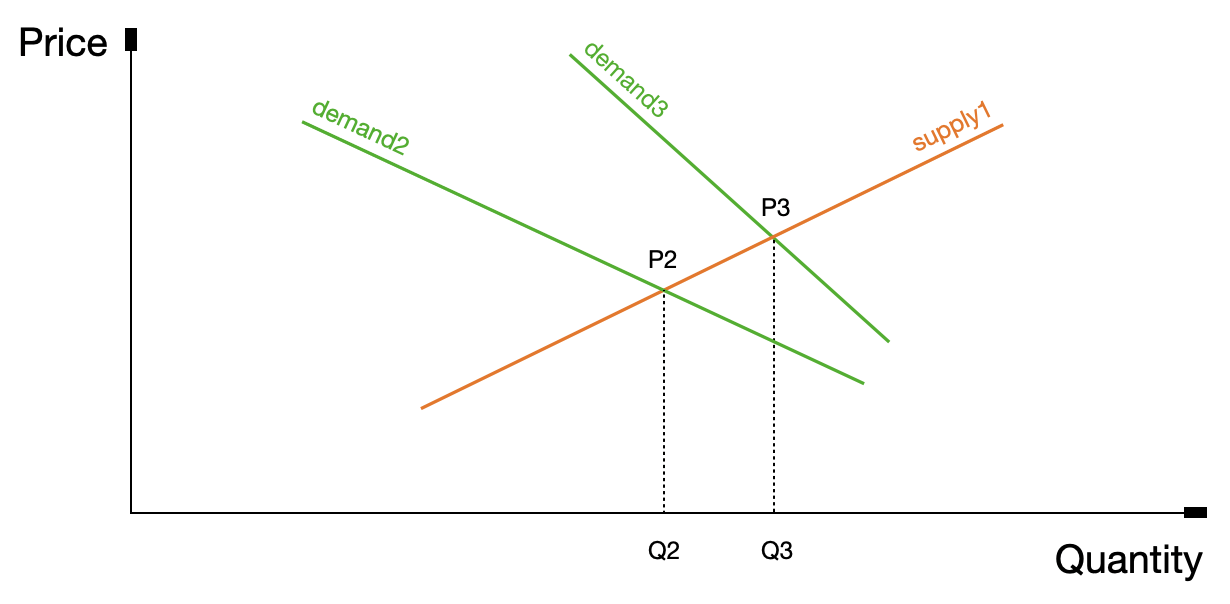
During the lockdown a specific effect took place: the demand curve became extremely inelastic (almost vertical). This was due to the fact that the face mask became a ‘fundamental’ good as opposed to ‘nice-to-have’ good. Supply, on the other hand, was still unchanged and demand, by now, had increased worldwide. Prices climbed even further, and a new equilibrium was found at price P3 and quantity Q3.
Some time after the COVID-19 lockdown
Here is when the first little microeconomic ‘miracle’ happened. More than 100 companies in Italy started a conversion process whereby they switched their production from the original products to face masks. The main reconversion sectors were the fashion, the socks and the personal hygiene industry.
Gucci, Prada and many other big names were able to produce 1.5 million masks per day by the end of April whereas the personal hygiene industry supplied 750,000 masks per day. This started shifting the supply curve towards the right. Prices started to fall slightly, finding a new equilibrium at P4 for a quantity Q4.

Post COVID-19 lockdown lifting
To protect consumers’ rights, as well as to stabilise the market, it seemed necessary for the government to intervene by setting a price ceiling P5* (the price ceiling was implemented for surgical face masks only), below the equilibrium price P4, preventing producers from further raising prices.

After the initial political euphoria, the government clarified that this price would be guaranteed to replenish the stocks for essential services such as hospitals, healthcare providers, public transport workers and the police force. The reality was that the public still needed to pay high prices for face masks.
There was a problem though: during the lockdown, only one mask per week was used to purchase groceries, but after the lockdown had been lifted one single usage face mask was needed every day for every worker in the household.
The reality is that most Italians cannot afford to purchase single usage face masks to go back to work; and this is when the hummingbird economics kicks in.
The Hummingbird Economics
Very high demand and still very limited supply. So, what is the solution?
Another phenomenon started to appear; something in which humans excel. The basic concept is the following: if the government does nothing to help you, then find a way to sort out the problem yourself.
Let me give you an example. My mum is a dressmaker and, like her, many other households have in one way or another a sewing machine at home. My mum made her first 30 face masks at the beginning of May and keeps on making them every day for construction workers, decorators, truck drivers, and more.
Like her, many others are just making their own face masks. These are what I call the hummingbirds: those Italians who are in their own little way contributing on a very small scale to fill the gap between demand and supply.
They are certainly not surgical grade face masks, but there seems to be evidence that even a cotton face mask can help preventing the spread of COVID-19 (see the Cambridge study of 2013 below). I am no expert to judge and neither is the aim of this article to determine if it is a good practice or not, but in the absence of a proper solution, it is the best that people can do. It is the solution provided by the hummingbird economics.
Each hummingbird supplies only four little drops to the demand, and each one of them does its little part but together hummingbirds can solve big problems in our society.
This is an example of a unique hummingbird at work, my mum:

Numerical recap
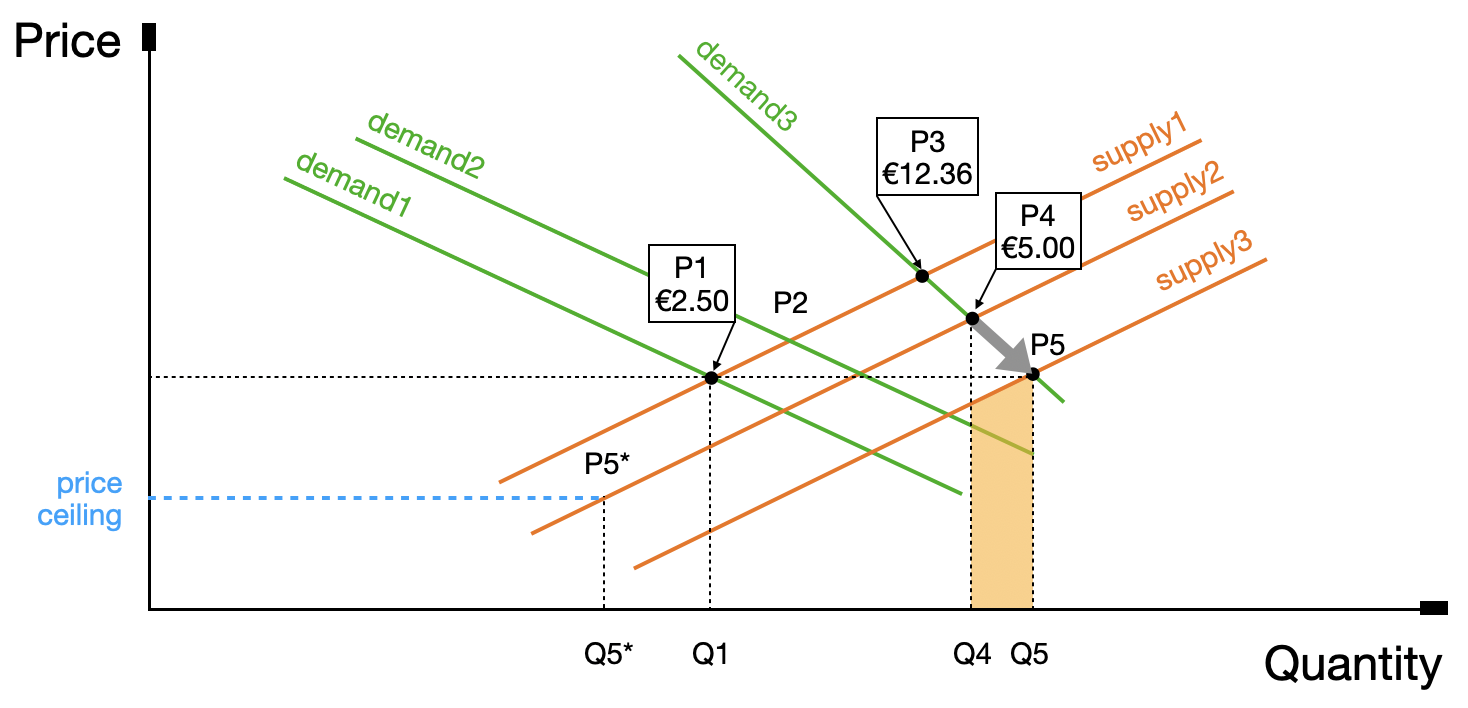
- All starts with a normal demand (demand1) and supply (supply1) at an equilibrium price P1. FFP2 face masks were selling at €2.50 as of December 2019.
- With the first few cases in the hospitals, demand increased (demand2) and so did prices to P2.
- By mid-March, the demand moved to the right and tilted clockwise (demand3); prices increased even further to P3 and FFP2 prices rose to €12.36 on March 13th, 2020.
- At the beginning of April, companies reconverted themselves into face mask producers, supply shifted to the right (supply2) and a new price P4 was reached.
- As of May, 2020, the government can supply 4 million masks a day, well below the quantity needed to fulfill the demand.
- As of May, 2020, the demand in Italy is nevertheless of 30 million masks a day, covering citizens, companies, public services such as healthcare providers, police force and public transportation.
- As of May, 2020, pharmacies and supermarkets are still selling masks at high prices: €1.50 for single usage surgical masks, €5.00 for FFP2 masks and €6.50 for cotton washable masks.
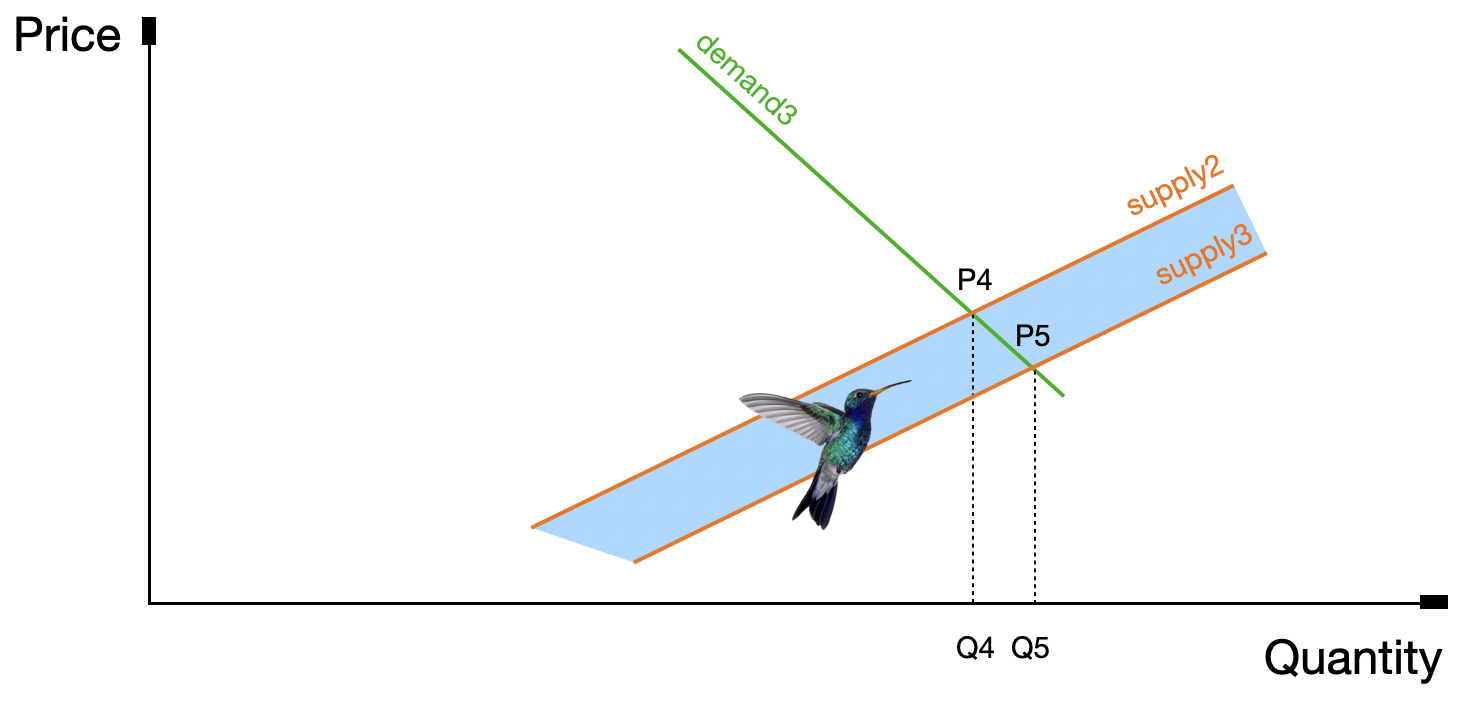
- At the beginning of May, the hummingbird economics kicked in, and the supply curve started shifting to the right (supply3) towards the equilibrium price P5, close to the initial price P1 and filling the gap between the needed quantity Q5 and the official quantity supplied Q4.
This is an interesting paper written in 2013 and published by Cambridge University Press that analyses homemade masks as an alternative to commercial face masks: Testing the Efficacy of Homemade Masks: Would They Protect in an Influenza Pandemic?


